

Counting Things: Counting Users Part 2
Counting Things: Counting Users Part 2
come on get a little bit closer baby, cause tonight is the night

In my last post, I walked through an example of counting people who visit your site, and the complexities that come with it. Next, we’ll explore what happens when a visitor becomes a user and emits a couple innocuous events.
When Two Become One
Let’s say Rachel visited your site over the past few months. For simplicity, she was kind enough to persist cookies, use the same device across both sites, and generally be friendly toward your site tracking. We are using something like Rudderstack, Segment, Amplitude, Mixpanel, Jitsu, or Snowplow for event tracking.
Rachel clicks the giant, blinking, iridescent ✨sign-up✨ button your growth team so thoughtfully placed in the middle of your website. She signs up with her email address and creates a password. Somewhere, a growth marketer wakes from her dreams. Success.
If your engineering team was kind and generous, they also instrumented the sign-up event and the subsequent sign-in, and now you have three types of events, and they might look like this.
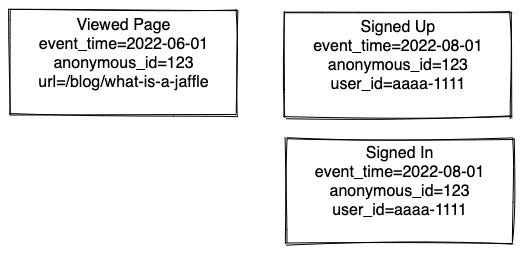
Our tracked events table, (let’s call it tracks), looks like this:
anonymous_id | event_name | event_time | user_id  | source
123          | viewed_page| 2022-06-01 | null     | web
123          | signed_up  | 2022-08-01 | aaaa-111 | nodejs
123          | signed_in  | 2022-08-01 | aaaa-111 | nodejs
A few things to note:
Your old rows don’t get updated when new information arrives. In June, we didn’t know the user id of our visitor, since they had not signed up. But in August we did have that information.
Events take place in different contexts. The first event was emitted from your marketing website on the front-end. The second and third were server-side events from the backend, directly to your event-tracker. The first event may not always fire, depending on ad-blocking, network blips or browser behaviour.
These nuances will make the lives of your data practitioners hard, so it’s important to have lots of sympathy and moral support for them when they inevitably start working on sessionization. Help is available, and they are not alone.
What Can We Do With Events?
Given just the three events, we can ask many different types of questions:
Attribution
What are the leading sources of user sign ups?
For people who signed up, what was the first page they visited on our marketing site? Or the last?
Adoption
How many people signed-up for my product each day?
How long does it take for an average visitor to sign-up?
What percent of visitors end up signing up for our product, and how does that change over time?
Engagement
How many people who sign-in to our product every day are new users?
How many of them are existing?
How many users stopped signing in?
How many users came back after a break?
Stitching User Events
Before we can start chipping away at our newly formed backlog of questions we still have to solve the fundamental problem of user stitching. We want to associate every event we have with the user id, even if the user was not known until later.
Given the simplified example above, we can create a mapping of anonymous_id → user_id by using a window function.
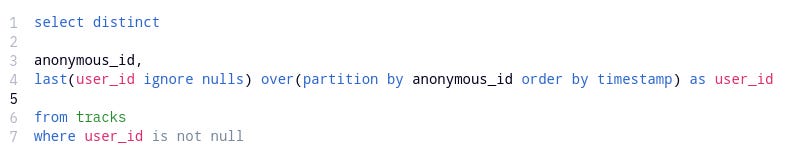
ROWS BETWEEN UNBOUNDED PRECEDING AND UNBOUNDED FOLLOWING to look past the current row for the last value. If you’re new to window functions, this can look daunting. Think of a window as a slice of a table. We want to operate on every row that has the same anonymous_id. In each slice, apply a function to get a result, and add it as a new column. In this case, we’re applying the last function, which finds the last row in that window.
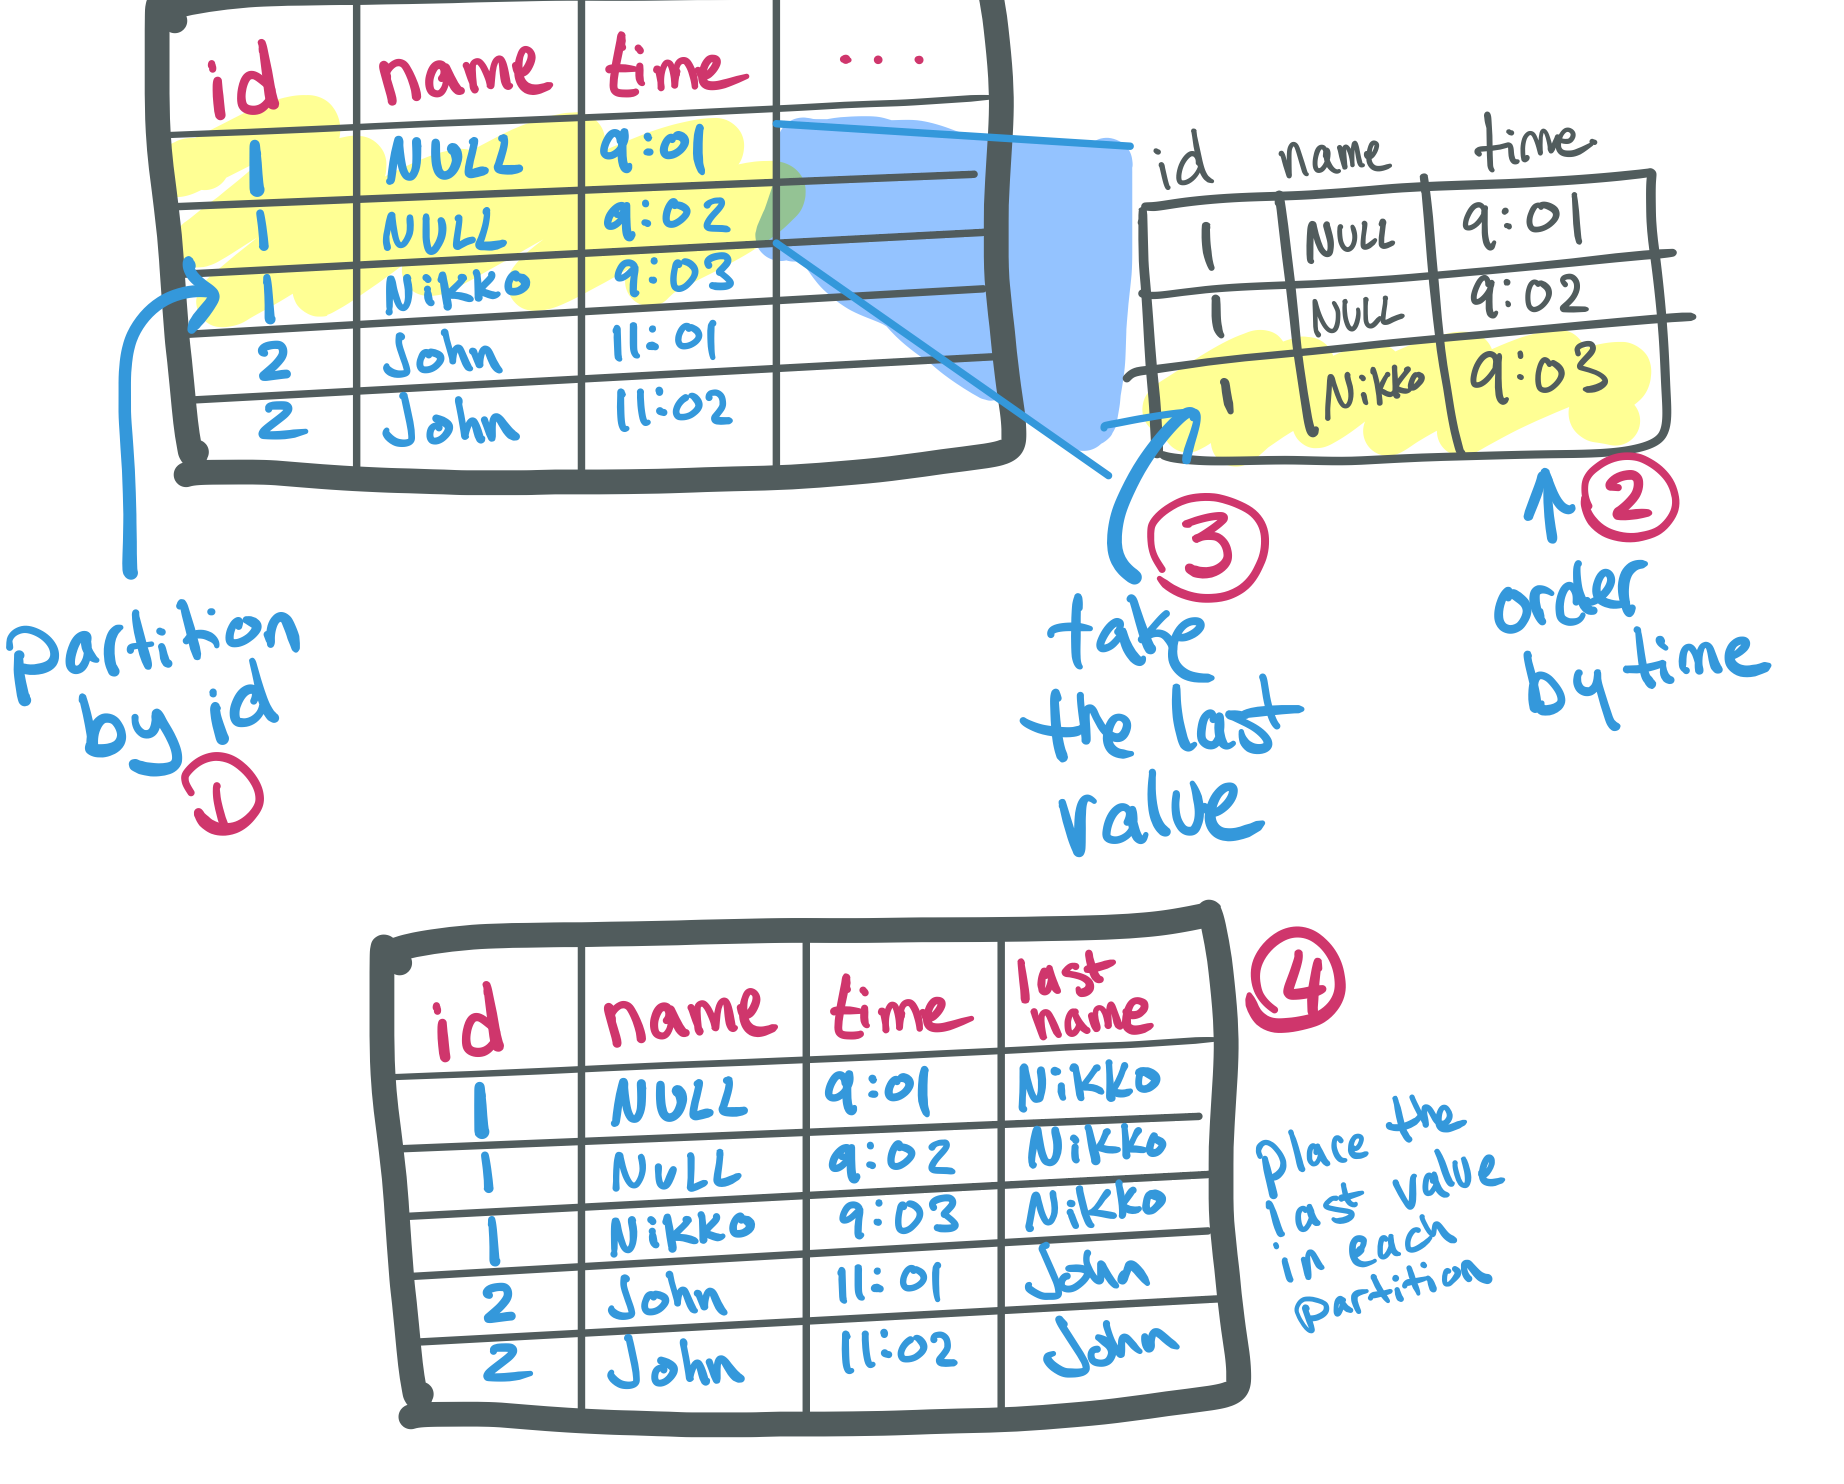
Here’s a little illustration of how a window function might work. Start by taking the partition highlighted in yellow, then within each partition order by timestamp, and then take the last value in that partition, and use that as the result that fills each row.
Once the events have been stitched, we have our desired output: a mapping of anonymous id to user id.
Conversely, we also know that any anonymous id that isn’t mapped to a user id has not signed up, or cannot otherwise be identified.
anonymous_id | user_id
123          | aaaa-111
124          | aaaa-111
125          | aaaa-111
234          | bbbb-222
789          | NULL      <- this person has never signed up
With the above, we can now start to chip away at our questions from before.
Attribution
What are the leading sources of user sign ups?
For people who signed up, what was the first page they visited on our marketing site? Or the last?
What we know:
all the visitors to our websites and how they got there (from Counting Users, Part 1)
which visitors eventually became users
So naturally, we can look at where visitors came from before signing up to understand where our sign-ups come from.
There are many models for attributing sign-ups to visits (all of them bad, some of them useful). The simplest ones look at either the first, or last thing someone did before they performed a conversion. Consider the following events:
anonymous_id| path   | utm        | referrer | event_time
123         | /      | cpc-google | google   | 2 days ago
123         | /blog/ | NULL       | bing     | yesterday
We start by joining anonymous_id above to a stitching table we created in the previous step, and let’s say we find that the anonymous user 123 is actually user aaaa-1111.
Pretend we also have a table that tells us when the user signed-up, and it was today. We can either give credit to a cost-per-click advertisement (first-touch attribution) or to our blog (last-touch attribution).
We can get more complex if we wish. Maybe we only want to look back a certain number of days. For example, does it make sense to give credit to a paid ad from 18 months ago if someone signs up today?
We might want to categorize different types of web traffic according to some rules by bucketing similar traffic together, such as social media sources. (There’s a great dbt seed file in the segment package that helps with this)
We may want to go beyond attributing conversion events, to better understand what brings new visitors to our site for the first time. For every user, we could look at the first page they visited and categorize that traffic to understand ‘landing pages’.
Hard to believe, but the answers to every single one of these questions starts with just a few events and stitching.
Adoption
How many people signed-up for my product each day?
How long does it take for an average visitor to sign-up?
What percent of visitors end up signing up for our product, and how does that change over time?
Understanding adoption is also made possible by the same types of events we used for attribution. If we look only at the sign-in events, we can count how many people visit our site like so:
select
date_trunc('day, timestamp) as event_day,
count(distinct user_id)

from tracks
group by event_day
This query counts the number of distinct users within a specified time period. We use count distinct because a single user often has multiple events a day.
If we want to know how long it takes for a visitor to sign-up, we can look at the time elapsed between their first visit, and their sign-up event.
with conversions as (
  /* Assume one signed-up event per user for simplicity */
    select
    user_id,
    timestamp as signup_date

    from tracks
    where event_name = 'signed-up'

)

select distinct

user_id,
first_value(timestamp) over(partition by stitched.user_id) as first_event_date,
signup_date,
datediff('days', first_event_date, signup_date) as days_to_signup

from tracks
join stitched using(anonymous_id)
We use a window function again, this time to get the first event. We count the days between the first event and the conversion to see how long it takes for someone to sign up.
We can also perform a very rudimentary funnel analysis by counting the number of new visitors and sign-ups each day.
To help us, let’s imagine a helper column called blended_user_id. It is the user id if it’s known, or the anonymous id if not.
We find the first event ever for a particular blended user id, and then find the first sign-up event for each user. Count the number of times each of those events happen, every day, and get a funnel count of visitors → users.
with visitors as (
    select

    date_trunc('days', timestamp) as day,
    count(distinct blended_user_id) as new_visitors

    from stitched_tracks
    group by day
    qualify row_number() over(partition by anonymous_id order by timestamp) = 1
),

signups as (

    select

    date_trunc('days', timestamp) as day,
    count(distinct blended_user_id) as new_signups

    from stitched_tracks
    where event_name = 'signed-up'
    group by day
    qualify row_number() over(partition by anonymous_id order by timestamp) = 1
),

select

day,
new_signups,
new_visitors

from visitors
full join signups using (day)
Engagement
How many people who sign-in to our product every day are new users?
How many of them are existing?
How many users stopped signing in?
How many users came back after a break?
We can even start to get into some fun churn and retention analysis. One really simple (and not useful) way to measure churn might be to count:
Anyone who signed in today that signed in yesterday (retention)
Anyone who signed in yesterday that didn’t sign in today (churn)
We’re using some really fun SQL now, by joining a single table to itself and offsetting the day in the join condition.
with daily_activity as (
  select distinct
    date_trunc('day', timestamp) as day,
    user_id
  from tracks
  where user_id is not null
),

retained as (
select
  today.day,
  count(distinct today.user_id) as retained
from daily_activity today
join daily_activity yesterday
  on today.user_id = yesterday.user_id
  and today.day = yesterday.day + interval 1 DAY
group by today.day
),

churned as (
select
  yesterday.day + interval 1 DAY as day,
  count(distinct yesterday.user_id) as churned
from daily_activity yesterday
left join daily_activity today
  on today.user_id = yesterday.user_id
  and today.day =  yesterday.day + interval 1 DAY,
where today.user_id is null
group by 1
)

select
day,
coalesce(retained, 0) as retained,
coalesce(churned, 0) as churned

from retained
full join churned using (day)
order by 1
This example was taken with great inspiration from the Sisense blog, so feel free to give it a read to really understand what’s going on. Don’t sweat if this one makes your head hurt, the goal here is really to show you how much you can do with just a couple events.
I hope this was a useful foray into the depths you can go to with event streams. The world only gets more complicated from here as you try to do things like tie ad spend to revenue by connecting Salesforce Accounts to Product Signups through intermediary tables. Yuck! Let’s pretend we never spoke of such things.
Did you enjoy this post? Do you have ideas for future metrics to cover? Maybe you think Cohort Analysis is something you’ve always wanted to learn more, or you think there’s nothing hotter than a well-defined activation metrics. Well, leave a comment or drop me an email!
A cookie may have multiple users associated with it. It seems to be a common choice[0] to use the "last_value". But why? Wouldn't it be better to use the first user ID, that way you guarantee that your mapping/stitching table never changes. As a consequence, downstream metrics will not jump around if a 2nd, 3rd, ... user gets associated with the same cookie.
[0] Snowplow does the same: https://github.com/dbt-labs/snowplow/blob/main/models/identification/default/snowplow_id_map.sql